Observability Dashboard
The AiCore observability dashboard provides real-time monitoring and analytics for LLM operations, offering insights into performance, costs, and usage patterns.
Key Features
- Interactive Visualizations: Dynamic charts for performance metrics
- Real-time Monitoring: Live updates of LLM operations
- Historical Analysis: View trends over customizable time periods
- Cost Tracking: Monitor API usage costs by provider/model
- Agent Monitoring: Track agent-specific metrics and performance
- Multi-source Data: Supports both live operations and historical data
Getting Started
Prerequisites
bash
pip install core-for-ai[observability]Basic Usage
python
from aicore.observability.dashboard import ObservabilityDashboard

# Create and launch dashboard
dashboard = ObservabilityDashboard()
dashboard.run_server(host="0.0.0.0", port=8050)  # Default port: 8050
Configuration Options
| Parameter | Description | Default |
|---|---|---|
from_local_records_only | Use only local JSON records | False |
refresh_interval | Dashboard refresh rate (ms) | 5000 |
Dashboard Components
Overview Tab
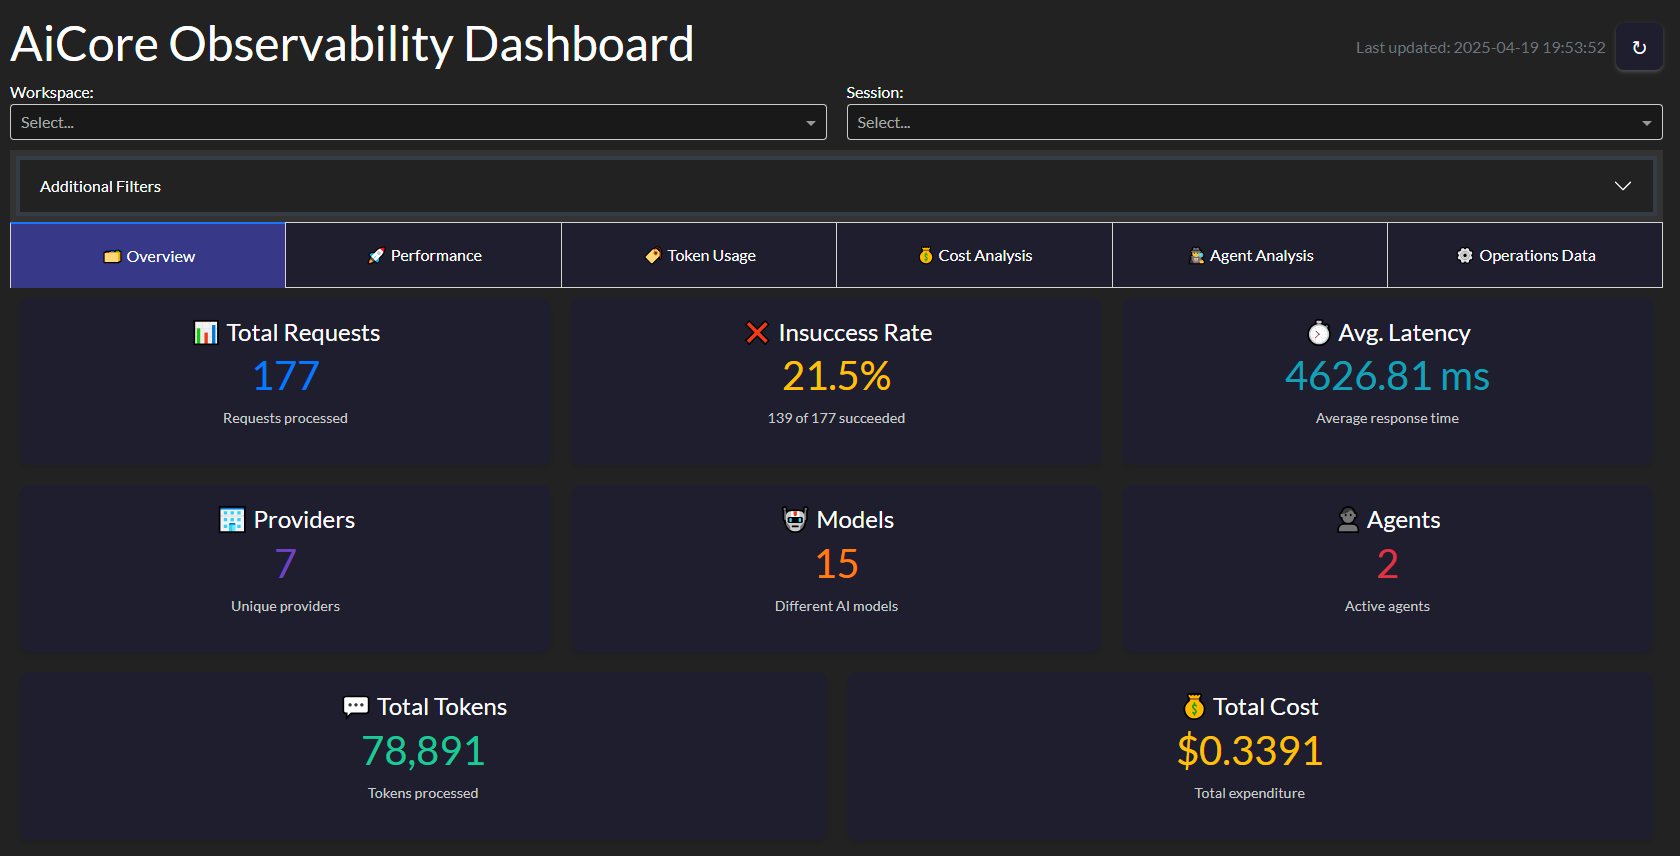
- Request Volume: Operations per time period
- Success Rate: Successful vs failed requests
- Provider Distribution: Usage by LLM provider
- Model Distribution: Breakdown by model
Performance Tab
- Latency Metrics: P50, P90, P95 response times
- Throughput: Requests per minute/second
- Error Analysis: Error types and frequencies
Cost Analysis Tab
- Cost Over Time: Daily/weekly/monthly spend
- Cost by Provider: Breakdown by API provider
- Token Efficiency: Cost per token metrics
Agent Monitoring Tab
- Agent Activity: Operations by agent/workspace
- Action Tracking: Most frequent actions
- Custom Metrics: User-defined agent metrics
Advanced Usage
Custom Data Sources
python
from aicore.observability.dashboard import ObservabilityDashboard
from aicore.observability.collector import LlmOperationCollector

# Load specific data range
collector = LlmOperationCollector()
df = collector.polars_from_db(start_date="2023-01-01", end_date="2023-12-31")

# Create dashboard with custom data
dashboard = ObservabilityDashboard(custom_data=df)
Embedding in Existing Apps
python
from fastapi import FastAPI
from aicore.observability.dashboard import get_dash_app

app = FastAPI()
dash_app = get_dash_app()

@app.get("/dashboard")
async def serve_dashboard():
    return dash_app.index()
Troubleshooting
Dashboard not loading data:
- Verify database connection settings
- Check collector is recording operations
- Ensure required ports are open
Performance issues:
- Reduce refresh interval
- Limit historical data range
- Use
from_local_records_onlyfor smaller datasets